


Electric vehicles in Africa: what’s needed to grow the sector
In sub-Saharan Africa, high levels of particulate matter (PM2.5) pollution from vehicle tailpipe emissions cause poor health, developmental stunting, and even death. Vehicle emissions also contribute to global warming.
Electric vehicles could help solve these problems but they’ve been slow to take off in the region. Its biggest economy, South Africa, had only about 1,000 electric vehicles by 2022.
We are specialist transport engineers whose research has focused on electric vehicles and road freight transport in sub-Saharan Africa. In our work we look at how electric vehicles could contribute to reducing emissions in the region, and what is standing in the way of electrifying transport.
One of the reasons for low uptake is the high cost of electric vehicles. They also have limited range and their batteries are slow to charge: a problem for long distance or frequent driving.
Read more: Electric vehicles in South Africa: how to avoid making them the privilege of the few
The inability of countries to generate and distribute enough clean electricity is also a barrier to electrifying vehicles. Just over half of all electricity in the region comes from burning fossil fuels. Powering electric vehicles with electricity generated by burning fossil fuels wouldn’t necessarily reduce carbon emissions.
However, the rollout of electric motorcycles and small public transport vehicles has already begun. If all vehicles could be made locally, using clean energy, there would be tremendous economic benefits for the region.
Electric mobility is some way off
Transitioning to electric mobility requires clean energy provision, which means investing in electricity infrastructure. Electric vehicle charging stations can be installed fast: South Africa already has a very high electric vehicle ratio of one charger for every five cars, compared to the UK at 1:20. But these charging stations must be able to deliver electricity when vehicles need it. They need reliable, renewable energy stored in large battery systems to do so – and these large battery systems are still being developed.
In sub-Saharan Africa informal public transport moves about 72% of the region’s passengers. Freight moves goods in the absence of adequate rail. Electrifying these sectors needs careful planning.
| The Roam Air electric motorbike that Stellenbosch University drove from Kenya to South Africa on only solar power. Lewis Seymour.
Informal “paratransit” or “popular transportation” is made up of minibuses (matatu, ndiaga ndiaye, danfo, trotro), three-wheelers (tuk-tuk) and motorbikes (boda boda, moto).
Planning for the eventual electrification of informal taxis is complicated by the sector’s unscheduled, decentralised, often chaotic and demand-driven nature.
Freight transport is a leading indicator for economic growth, and for economies to grow, freight transport must grow. This means that national and local governments must plan and invest in high powered, fast charging stations along transport routes. These must be able to charge different sizes and kinds of trucks. The freight industry cannot absorb these costs alone.
Need for rapid change
The transport sector must make the transition to electric mobility faster than the breakneck speed at which smartphones were adopted if it is to meet Net Zero – an end to carbon emissions – by 2050. Costly electrical and civil infrastructure (roads, minibus termini, truck stops, electricity distribution networks) will be needed – and soon.
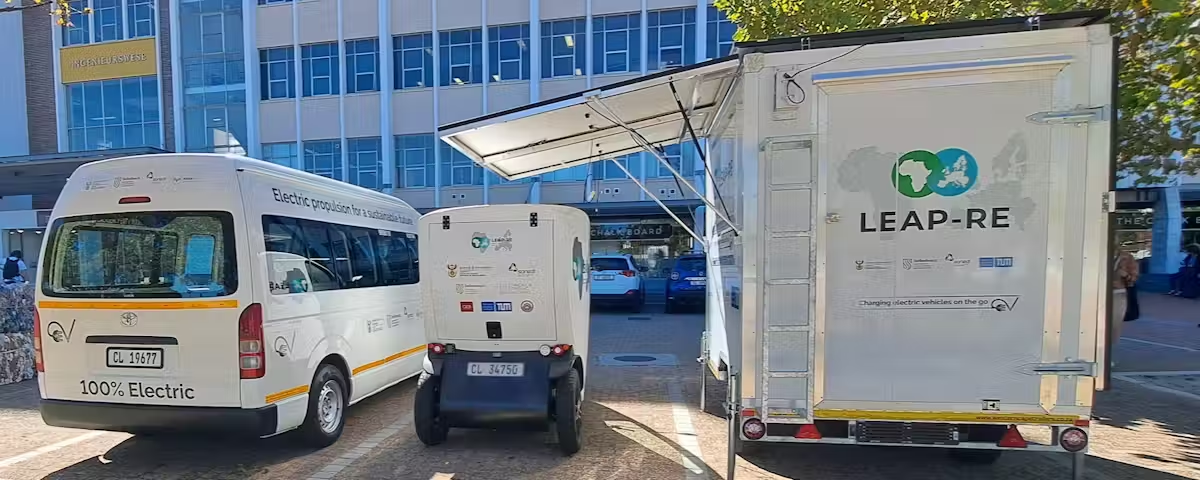
| Electric vehicles and a mobile charging unit. MJ Booysen
However, our results show that fleets will have to contain a mix of electric and combustion-based engines if countries want to continue to transport the same amount of goods and people they are currently transporting. This is because electric vehicles charge slowly. While a diesel minibus taxi takes only one minute to fill up with enough diesel to travel 750 kilometres, the fastest currently available electric minibus recharges at a mere 2km per minute with DC and 0.3km per minute with AC. The electric taxi’s range is also only 21% of the diesel equivalent.
Filling stations in the region generally store the equivalent of up to 225,000km worth of fuel for a diesel minibus. The same size of stationary electric battery storage will store a mere 16,000km for an electric equivalent minibus. Range-extending and potentially swappable battery storage can be used (where a trailer acts as a mobile battery bank to the vehicle, and is charged from a solar charging station to reduce emissions). But this will increase the cost so much that it may not be financially viable for the freight industry at all.
Building a local electric vehicle industry
Except for South Africa, the region has been a dumping ground for second hand vehicles from developed countries. The comparatively simple designs of electric vehicles provide an opportunity for sub-Saharan Africa to move away from accepting second hand vehicles and towards a new local electric vehicle industry.
Workers in hundreds of thousands of jobs making combustion engines could be reskilled to make electric vehicles. Africa already has the skills to design and produce the powertrain components, such as batteries and electric motors. Setting up local industries would also spare sub-Saharan Africa from being flooded by cheap electric vehicle imports that don’t contribute to local employment.

| Roam air electric motorbike and Golden Arrow’s electric bus at Stellenbosch University’s Electric Mobility Day. Stefan Els.
Ethiopia has recently banned the import of combustion vehicles. Africa’s first all-electric mass rapid transit was set up in Dakar, Senegal in 2023. The Golden Arrow bus company in South Africa purchased 120 electric buses this year. Heavy haul electric trucks are also entering the South African market space.
Africa has already produced tens of thousands of electric two- and three-wheelers used for public transport and last-mile delivery. These include Ampersand in Rwanda, Roam Electric in Kenya, and Spiro in Benin. Batteries are usually provided through swapping and payment by mobile phone. In South Africa, Mellowvans produce a last-mile three-wheeler.
| The converted electric taxi. Stefan Els
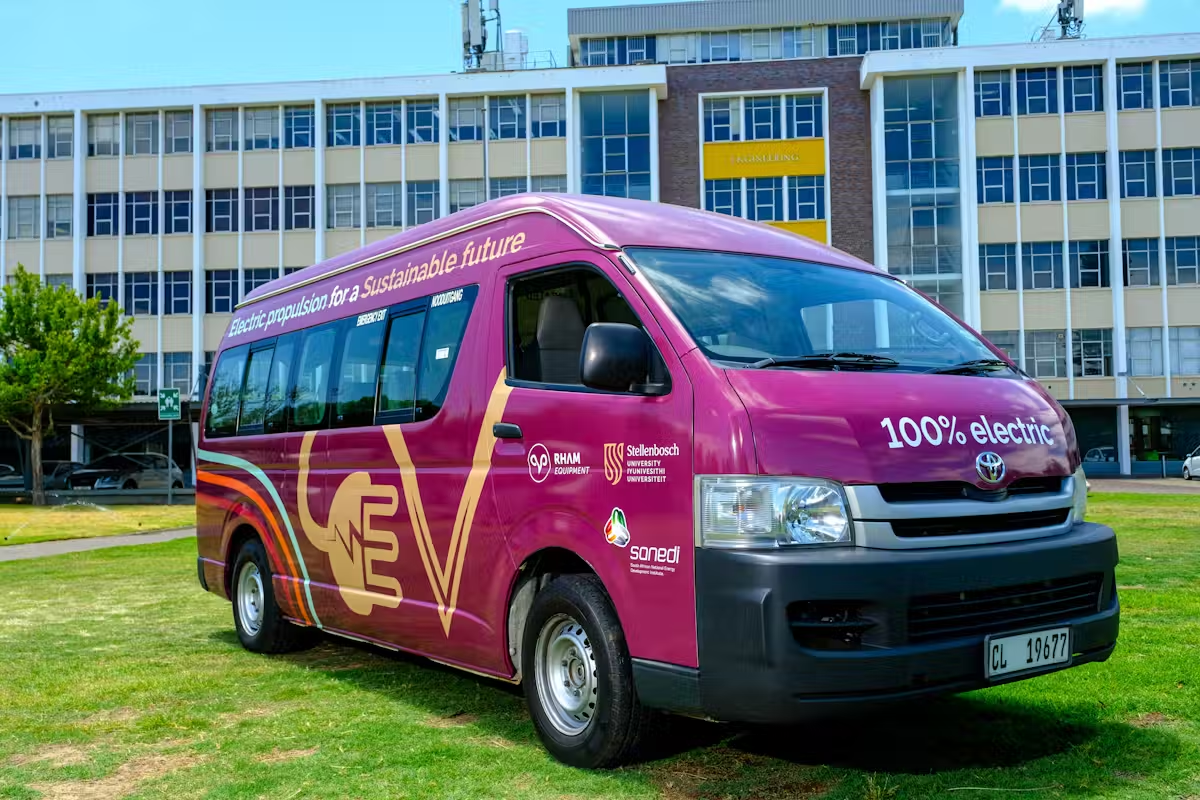
A Roam Air electric motorbike recently completed the 6000km journey from Nairobi to Stellenbosch using only the region’s abundant solar power. In Kenya, BasiGO assembled buses locally and now provides finance for electric buses. Roam Electric makes locally designed electric buses (and motorbikes). Meanwhile, a project owned by the South African National Energy Development Institute at Stellenbosch University in South Africa has converted a petrol minibus taxi and a 65-seater diesel bus to electric.
Electrification is inevitable
The shift to electric vehicles is inevitable. These steps are needed first:
- Review transport policy related to freight vehicles, such as axle weight and vehicle length, to ensure that imported electric vehicles can operate on African road networks.
- Ensure paratransit is safe, efficient and equitable.
- Carefully consider import duties and incentives. Rwanda scrapped customs tax on electric vehicles to make them cheaper, but this led to an influx of old hybrid vehicles with depleted batteries. South Africa has vehicle import duties to protect local production, but an additional luxury tax on electric vehicles makes these expensive to buy.
- Rethink the taxation model. In South Africa, for example, fuel levies make up a chunk of national revenue.
To make the most of the electric mobility revolution, sub-Saharan African countries need policies and incentives to localise production and invest in green energy, lest they miss the bus.


Botswana’s new president: who is Duma Boko and what does he stand for?
Who is Duma Boko and what does he stand for?
Duma Boko is the leader of the Botswana National Front and president of an opposition coalition, the Umbrella for Democratic Change. He played a crucial role in the process of forming the coalition in 2012 by three political parties: the Botswana National Front, the Botswana Movement for Democracy and the Botswana People’s Party. For the 2024 elections, the coalition included the Botswana National Front, the Alliance for Progressives and the Botswana People’s Party.
Boko is a human rights lawyer who is considered a social democrat. He read law at the University of Botswana and at Harvard Law School. He was raised in a modest family in Mahalapye, a village 200km from the country’s capital, Gaborone.
The country of 2.5 million has very high levels of unemployment, at 27.6%, as well as poverty, at 38%.
His campaign pledges suggested that he stands for and identifies with the lower economic strata of society.
One of his key messages was a promise to diversify and transform the economy from over-reliance on minerals, particularly diamonds, which account for 90% of exports. He also promised to raise the basic pay, students’ allowances and old-age pensions. He pledged to make matters afflicting the youth a priority as around 70% of the country’s population is below 35 years old.
As a constitutional and human rights lawyer, Boko has emerged as a leader who is keen to advance social justice. And owing to his training, he preaches a humane approach to issues confronting the nation. He has lived and practised respect for human rights, especially the rights of the downtrodden, including the Basarwa (the San) – the indigenous people of Botswana.
What challenges does he face?
Boko’s government is taking charge of a country with underdevelopment challenges.
The two biggest are unemployment and poverty, which intensified under Masisi’s government.
The other critical challenge is corruption, which escalated under Masisi and came to define his time in office as some of his relatives benefited from government tenders. Institutions that were meant to ensure transparency and accountability were muted or ineffective. In addition, the Directorate on Intelligence and Security Services began to operate as a law unto itself and was considered to have gone rogue. There were reports that it obstructed investigations by the Directorate on Corruption and Economic Crime, among others, of those considered politically connected. And there were reports that it had assumed roles outside its mandate, such those of the police, and the corruption and economic crime directorate.
Masisi, who also stood accused of corruption, took no action. He has denied the allegations.
Institutions that were meant to provide accountability, such as the Directorate on Corruption and Economic Crime and the judiciary, were weakened or compromised under his government through interference.
What will it take for Boko to succeed?
Until around the mid-2000s, Botswana was widely lauded by international agencies and observers for its positive economic and social indicators relative to its peers. Yet, a significant proportion of its population has been left out, due to neo-liberal policies pursued by the ruling party since independence.
Boko’s government needs to devise new strategies to fight poverty and unemployment.
Secondly, Boko’s government needs to unite the nation, which became increasingly divided as the ruction between Masisi and former president Ian Khama escalated. The Directorate on Intelligence and Security Services was at the centre of their friction. Masisi was considered in certain quarters to make government appointments on regional (and tribal) lines.
Thirdly, Boko needs to restore trust and credibility in government and its institutions, including the judiciary. Trust is low. This requires revamping institutions that ensure transparency and accountability in government, containing the rogue intelligence directorate and ending wasteful expenditure and corruption.
Fourth, his government needs to transform the economy to create jobs. This is critical as he assumes power at a time when the diamond market is subdued. It is the country’s largest revenue earner.
These challenges do not have a simple solution. They will require that his government consult citizens in order to carry them along. Effective checks and balances must ensure the transparency and accountability that eluded the previous government.


Africa’s cities are growing chaotically fast, but there’s still time to get things right – insights from experts
Cities are vital engines of economic growth, innovation and social progress. They shape the futures of nations and the lives of millions.
In Africa, urbanisation is accelerating at an unprecedented pace. Cities are expanding rapidly to accommodate a booming population and a surging demand for jobs, housing and infrastructure. This can make life in many African cities very challenging due to high unemployment rates, limited infrastructure, and issues like housing shortages and inadequate public services.
The good news is that most of Africa’s urbanisation is yet to come, so there is still time to get things right. There’s the opportunity to learn from the successes and challenges faced by cities in other parts of the world.
Over the years we’ve published several articles that offer lessons for Africa’s cities. With this knowledge, African urban centres can build more sustainable, inclusive and resilient spaces that truly meet the needs of their communities.
Urban economist Astrid R.N. Haas writes that Africa is undergoing the fastest urban transition the world has experienced to date. It’s projected that nearly 1 billion more people will live in Africa’s cities by 2050. Earlier, China was in the top spot: between 1978 and 2010, over 700 million people moved to China’s cities.
There are some lessons that African countries can take from China.
As urbanisation progresses, Haas explains, demand for land will rise and therefore so will prices. But the beneficiaries of higher land prices will be property owners, unless there are mechanisms in place to recoup the value. City governments need to try to capture this value, boost revenue and reinvest in public goods and services.
Hong Kong is a prime example of effective land value management. Land revenue has funded high quality public transport, as well as social infrastructure like schools and hospitals.
Hong Kong uses multiple instruments to do this. In this article, Haas unpacks one of these – the land lease system.
Read more: Raising revenue from land: what African cities might learn from Hong Kong’s unique land-lease system
Cities have historically been the drivers of productivity and engines of economic growth. Astrid R.N. Haas argues, however, that one factor preventing this potential from being unlocked in African cities is how the cities are governed: it matters who makes the decisions and how they do it.
In this article, Haas highlights what it takes to run a city effectively.
First, cities must have institutions with clearly defined mandates. This can be done by creating a single agency responsible for a service or policy decision. In Lagos, Nigeria, for example, an agency was created which coordinates the work of all transport-related entities.
Second, municipal governments need the capacity to implement decisions. For example, in 2013 Baghdad’s deputy mayor created a steering committee to improve the city’s sewerage system. The committee brought together various senior city staff and helped improve the timeliness and overall streamlining of decision making. This contributed towards significant improvements to the city’s sewerage network.
Third, making and implementing decisions requires sufficient legitimacy. This can be done, for instance, through elections, improving public communication or participatory budgeting – a mechanism which creates an established channel for identifying priority projects for people.
Read more: Getting the right institutions in place to run Africa’s cities efficiently
The need for effective governance is highlighted in this article by urbanisation expert Patricia Jones. She argues that, done right, urbanisation has the potential to raise productivity and living standards across Africa.
Jones writes that successful cities serve two functions: they provide liveable environments for workers and their families; and they provide productive environments for businesses.
To do this, there needs to be a focus on co-ordination and planning.
Read more: Done right, urbanisation can boost living standards in Africa
One of the challenges to Africa’s cities that needs to be highlighted is unsustainable urbanisation. It creates a situation where infrastructure development and service delivery aren’t keeping pace with the city’s growth, creating an unsafe and unhealthy environment. One approach to dealing with this is through family planning.
Demographer Sunday Adedini explored how family planning policies and urban development programmes in Nigeria were linked between 2000 and 2020. His study found that family planning and urban development actors mostly worked in silos. This was a result of systemic barriers like the lack of a policy framework and support for sectors to work together.
This suggests that there’s a need to integrate family planning and health more effectively into urban and territorial planning. This will contribute to preventing unsustainable urbanisation and urban poverty.


What if the Key to Revolutionizing Indonesia’s Agricultural Industry Lies in Simple Gathering Point/Titik Kumpul?
After spending some time in my current role at Elevarm, I strongly believe that one of the most promising solutions to these challenges is implementing a ’titik kumpul’ model or aggregator as a central hub for marketing and distributing agricultural produce, particularly for commodities like chili peppers.

| The Scale of Indonesia’s Agricultural Production: Marketing and Distribution Challenges
Most farmers in Indonesia operate on a small scale, typically managing plots of land between 0.5 to 2 hectares. With such a small scale, chili production becomes scattered and fragmented, making marketing and distribution inefficient. Small-scale farmers often face difficulties in selling their harvest due to limited access to larger markets or efficient distribution networks. As a result, they often rely on intermediaries, reducing the profit margins that farmers can retain. This situation contributes to the low bargaining power of farmers in the agricultural supply chain, making them vulnerable to price fluctuations.
The small scale of production units also makes it difficult to track chili production in Indonesia on a real-time, daily basis. This poses a unique challenge, especially given that chili is a daily staple for many Indonesians. For example, in the supply chain of electronic products, demand can be estimated with relative ease, allowing players within it to adjust their supply accordingly. However, this isn’t the case for the chili supply chain, which is mostly dominated by small-scale farmers and small businesses. As a result, there’s often a disconnect between supply and demand across many regions. This imbalance is a major factor behind the high price fluctuations in chili commodities.
High price fluctuations never benefit anyone except for large capital speculators. In developing countries with significant economic disparities, such as Indonesia, extreme price fluctuations that can be exploited by large capital speculators to multiply their profits will only exacerbate the situation. This creates a scenario where the wealthy have increasingly wider opportunities to enhance their prosperity, while those without capital face the opposite. Consequently, this will increase the wealth gap within Indonesian society.
| Streamlining Agricultural Efficiency: The Role of the ‘Titik Kumpul’ Model
As we confront the multifaceted challenges of Indonesia’s agricultural sector, particularly in the realm of chili production, we turn our attention to the potential inherent in the “titik kumpul” model. This aggregator functions as a central hub that consolidates harvests from various small-scale farmers for processing, packaging, and more efficient distribution. In the context of chili commodities, a titik kumpul can serve as an entity that integrates production from multiple farmers, thus providing a larger and more consistent volume of chilies to broader markets. Through this aggregation, a larger economy of scale can be achieved, improving price competitiveness and reducing distribution costs.
By using this model, farmers no longer need to sell their produce individually, which is often inefficient. Instead, they can rely on an aggregator to manage logistics and marketing, allowing them to focus on production. Additionally, by consolidating the harvest, titik kumpul can offer products with more uniform quality and meet the standards required by modern retail markets and the processing industry.
On the macro level, we can envision that when 80% of chili products are marketed through titik kumpul, the process of collecting national daily chili production data will become much easier and more accurate, with titik kumpul serving as data providers. This enables an efficient supply chain that aligns with demand in each region, thereby helping to prevent extreme price fluctuations.
| The Hopes: Integration of Technology and Knowledge in Titik Kumpul
One of the significant advantages of the ‘titik kumpul’ model is the opportunity to integrate modern technology and knowledge into the agricultural system. Professionally managed collection points can serve as centers of information and education for farmers, providing access to the latest technology, cultivation training, and improvements in production quality. For example, with the establishment of a titik kumpul, the use of technologies such as precision irrigation systems, sensor-based pest control, and efficient fertilizer application can be promoted and more widely adopted.
Aggregators can also facilitate the application of digital technology in the marketing of agricultural products. For instance, real-time data on production and prices can be collected, making decision-making in selling products more informed. By managing data from various farmers, titik kumpul can offer more accurate projections of supply and demand, helping to prevent overproduction or supply shortages, which often cause price fluctuations in chili commodities.

| The Potential for Developing Indonesia’s Agricultural Industry
This titik kumpul model presents significant potential for the development of Indonesia’s agricultural industry, particularly in chili commodities. By increasing the scale and efficiency of production, this model not only benefits farmers economically but also reduces inefficiencies in the distribution chain. Well-managed collection points can create a more organized and measurable system, reducing waste and ensuring higher product quality. On a national scale, the adoption of this model could be one of the keys to creating a more modern, sustainable, and competitive agricultural industry.


IDM’s Sustainable Science Initiative: A first for Africa in greener research
As the global impacts of climate change and environmental harm worsen, the Institute of Infectious Disease and Molecular Medicine (IDM) at the University of Cape Town (UCT) has taken a step towards greener practices and policies with the launch of its Sustainable Science Initiative (SSI). The groundbreaking project aims to reduce the environmental footprint of the Institute while maintaining its status as a world-class research institution.
Through its partnership with the internationally recognised non-profit My Green Lab, the IDM has become the first academic research institution in South Africa – and across Africa – to pursue My Green Lab Certification. This certification, which guides laboratories through the process of improving sustainability across multiple categories, is considered the international gold standard for laboratory sustainability best practices, promoting responsible research practices and reducing the carbon footprint of labs. It positions the institute at the forefront of a global movement towards sustainable science.
A vision for greener science
The core vision of the SSI is to achieve My Green Lab Certification and by integrating sustainability into every facet of its operations. My Green Lab is recognised by the United Nations (UN) as part of its Race to Zero campaign, which seeks to halve global emissions by 2030. Over 3 000 laboratories are enrolled in the My Green Lab Certification programme worldwide, helping them to reduce their environmental impact and foster sustainable research practices.
“The IDM … is the first academic research institution in South Africa … to pursue My Green Lab Certification.”
“We are proud to confirm that the IDM at the University of Cape Town is the first academic research institution in South Africa – and indeed, across the entire African continent – to pursue My Green Lab Certification. We hope this milestone will serve as a source of inspiration, setting the standard for sustainable science not just in South Africa, but throughout Africa,” said Jack O’Grady, the senior programme manager at My Green Lab.
For the IDM, the road to sustainability also includes two additional projects: integrating solar power into the institute’s operations and tracking the carbon footprint of its research activities. By adopting these measures, it hopes to reduce its reliance on traditional energy sources and foster a culture of sustainability that can serve as a model for other academic and research institutions.
Leading the sustainable science effort
The SSI is spearheaded by the head of the IDM’s operations team, Selisha Naidoo, who has been instrumental in driving the initiative. Naidoo emphasised the dual responsibility of scientific progress and environmental protection, stating, “Biomedical research is crucial for improving human health, but paradoxically it is inextricably linked to practices that carry a significant environmental cost, contributing tremendously to the climate crisis. Through the SSI, we’re not only committing to scientific excellence but also to protecting the planet that sustains life. With this initiative, we would like the IDM to become national leaders in demonstrating that excellence in biomedical research is inseparable from environmental stewardship.”
Raising awareness: merging art with science
To kick off the SSI, the IDM exhibited Mycoremediation 2050, a futuristic art installation, created by UCT’s Michaelis School of Fine Art graduate Reece Brice. This installation aligns with the institute’s sustainability goals by exploring nature-based solutions to pressing environmental challenges like plastic pollution.
Brice’s exhibition envisions a future where mushrooms play a crucial role in breaking down plastic into organic matter, a process known as mycoremediation. “By 2050, it’s predicted that there could be more plastic than marine life in our oceans,” Brice explained. “With Mycoremediation 2050, I wanted to offer a vision of hope. Highlighting fungi’s natural ability to remediate plastic waste, my goal is to spark a space for intervention and solution-seeking ideas in any form. As an artist, my role is to process information and express it in ways that captivate and connect with people, fostering positive change – particularly for the environment.”

Constructed from plastic materials, the exhibition serves as both a cautionary tale and a symbol of optimism, reflecting the SSI’s mission to integrate greener practices into research. Brice’s work is a powerful reminder that innovative solutions, like the My Green Lab Certification and SSI, can help mitigate the environmental impact of scientific research.
“Mycoremediation 2050 imagines Earth’s future, where mushrooms, nature’s composters, are central to addressing the plastic waste crisis. This vision aligns with the IDM’s SSI mission to combine innovation with environmental stewardship,” Brice concluded.
The urgent need for sustainable research
Scientific research, while essential for progress, has significant environmental consequences. Globally, life science laboratories generate approximately 12 billion pounds of plastic waste annually. Laboratories also consume up to 10 times more energy and four to five times more water than similarly sized office spaces.
Given the IDM’s significant footprint – comprising over 20 research groups, 56 laboratories, and five buildings – there is an urgent need to address its environmental impact. From single-use plastics to high energy consumption and the carbon emissions generated by research activities, the SSI aims to set a new standard for green laboratory practices in South Africa and Africa.
UCT’s director for Environmental Sustainability, Manfred Braune, noted: “It is a wonderful demonstration of leadership by UCT’s IDM to take this bold step towards gaining a better understanding of and improving their environmental footprint, especially in such a complex scientific laboratory-intensive environment. I look forward to supporting them on this journey and hope to see many other research institutes across UCT and other African institutes follow suit.”
As the global community continues to grapple with the effects of climate change, the IDM’s actions are a powerful reminder that the future of science must be green. IDM’s director, Professor Digby Warner, commented, “The IDM’s partnership with My Green Lab is much more than just a certification process – it’s a commitment to long-term sustainability in all of the IDM’s activities. By pursuing this certification, we hope to advance the environmental agenda at UCT while demonstrating our awareness of the need to conduct impactful research that is sensitive to the intimate interplay between climate and health.”
Author: Yulisha Naidoo

There Are Now More Electric Vehicles Than Gas-Powered Cars in Norway
Transportation is the single biggest contributor to climate change in the US—accounting for 28 percent of total greenhouse gas emissions, according to the Environmental Protection Agency. So, the rise of electric vehicles has been one of the biggest success stories in the effort to clean up the economy.
Slowing sales growth for battery-powered cars has some worried there might be a ceiling to the number of people willing to adopt the technology. But Norway shows that with the right incentives, the goal of a completely electrified road network is a tangible possibility.
Earlier this week, the Norwegian Road Federation (OFV) announced that of the 2.8 million private cars that are registered in the country, 754,303 are all-electric compared to 753,905 that run on gasoline.
“This is historic. A milestone few saw coming 10 years ago,” OFV director Øyvind Solberg Thorsen told The Guardian. “The electrification of the fleet of passenger cars is going quickly, and Norway is thereby rapidly moving towards becoming the first country in the world with a passenger car fleet dominated by electric cars.”
This tipping point had been long anticipated, as electric vehicle sales in Norway have massively outpaced gasoline cars for some time. Roughly 85 percent of new vehicles registered in 2024 so far have been zero-emissions, which refers to fully battery-powered vehicles and excludes hybrids.
It’s no secret how the country got here. The Norwegian government has given generous subsidies to promote adoption, including tax rebates that bring the cost of electric vehicles down to similar levels as conventional vehicles, exemptions from some tolls, and an extensive public network of free chargers.
Despite overtaking gasoline-powered cars, electric vehicles are still lagging diesel ones, which account for more than a million of Norway’s existing stock. But the government has an ambitious goal to end the sale of new gasoline and diesel cars by next year, so it may not be long before they catch up.
How easily other countries can mimic their success remains to be seen though—tax exemptions on electric vehicles cost 43 billion kroner ($4.1 billion) in 2023. Norway has been able to pay for this thanks to the country’s massive $1.7 trillion sovereign wealth fund, which, ironically, was built using the profits from its enormous fossil fuel reserves.
Electric vehicle sales have been highly concentrated in three main markets—Europe, the US, and China—accounting for roughly 95 percent of all purchases. In the US, new registrations grew 40 percent last year to hit 1.4 million, while Europe saw a 20 percent increase to 3.2 million.
However, sales have been flagging in recent months, even as production capacity continues to ramp up. This has some worried that concerns around pricing and charging infrastructure could cap consumers’ willingness to make the switch. A brewing trade war over electric vehicles between the West and China also threatens to further dent adoption.
While it might not come cheap, if we’re committed to decarbonizing our transportation system, other governments may need to follow Norway’s lead when it comes to incentivizing cleaner cars.
Image Credit: Emil Dosen / Unsplash

Author: Edd Gent

Four-day school week: Research suggests impacts of a condensed schedule vary by student group, school type
We updated this piece on the four-day school week, originally published in June 2018, on July 15, 2023 to include new research and other information.
More than 2,100 public schools in 25 states have switched to a four-day school week, often in hopes of recruiting teachers, saving money and boosting student attendance, researchers estimate.
Small, rural schools facing significant teacher shortages have led the trend, usually choosing to take off Mondays or Fridays to give employees and students a three-day weekend every week. To make up for the lost day of instruction, school officials typically tack time onto the remaining four days.
In some places where schools made the change, school district leaders have marveled at the resulting spikes in job applications from teachers and other job seekers. Teacher shortages, made worse by the COVID-19 pandemic, have plagued public schools nationwide for decades.
“The number of teacher applications that we’ve received have gone up more than 4-fold,” Dale Herl, superintendent of the Independence, Missouri school district, told CBS News late last year.
The impact on students, however, has not been as positive. Although peer-reviewed research on the topic is limited, focusing only on a single state or small group of states, there is evidence that some groups of students learn less on a four-day schedule than on a five-day schedule.
A new analysis of student performance in six states — Colorado, Iowa, Kansas, Montana, North Dakota and Wyoming — finds that students who went to class four days a week, as a whole, made less progress in reading during the academic year than students who went five days a week. Kids on a four-day schedule earned lower reading scores on a spring assessment known as the Measures of Academic Progress Growth, on average.
However, the authors of the paper, published last month, also found that the condensed schedule had little to no effect on the rural students they studied, on average. Schools located in towns and suburbs, on the other hand, saw student performance drop considerably after adopting a four-day week.
The authors also discovered differences among student groups. For example, Hispanic students going to class four days a week made less progress in math during the school year than white students on the same schedule. White students made less progress in math than Native American students during the 11-year study.
“For policymakers and practitioners, this study addresses previous ambiguity about the effects of four-day school weeks on academic outcomes and provides evidence supporting concerns about four-day school week effects on student achievement and growth, particularly for those implemented in non-rural areas,” write the authors, Emily Morton, Paul Thompson and Megan Kuhfeld.
In the spring before the COVID-19 pandemic, a total of 662 public school districts used the schedule — up more than 600% since 1999, Thompson and Morton write in a 2021 essay for the Brookings Institution. That number climbed to 876 during the 2022-23 academic year, they told The Journalist’s Resource in email messages.
In addition to studying the schedule’s effect on student achievement, researchers are also investigating its impact on other aspects of school operations, including education spending, student discipline and employee morale. To make the research easier to find, the University of Oregon’s HEDCO Institute for Evidence-Based Educational Practice has created the Four-Day School Week Research Database.
Anyone can use the interactive platform to sift through research completed as of May 2023. It’s worth noting that most research in the database is not peer-reviewed journal articles. Seventy of the more than 100 papers are student dissertations, theses and other papers.
If you keep reading, you’ll find that we have gathered and summarized several relevant journal articles below. To date, the scholarly literature indicates:
- Some schools cut instructional time when they adopt a four-day schedule.
- The impact of a four-day school week differs depending on a range of factors, including the number of hours per week a school operates, how the school structures its daily schedule and the race and ethnicity of students.
- The condensed schedule does not save much money, considering employee salaries and benefits make up the bulk of school expenses. In a 2021 analysis, Thompson estimates schools save 1% to 2% by shortening the school week by one day.
- Staff morale improves under a four-day school week.
- Fighting and bullying decline at high schools.
Both Thompson and Morton urged journalists to explain that the amount of time schools dedicate to student learning during four-day weeks makes a big difference.
“It’s pretty critical to the story that districts with longer days (who are possibly delivering equal or more instructional time to their students than they were on a five-day week) are not seeing the same negative impacts that districts with shorter days are seeing,” Morton, a researcher at the American Institutes of Research, wrote to JR in late 2023.
In a follow-up conversation with JR in July 2024, Morton pointed out that parents like the four-day schedule despite concerns raised by education scholars. In interviews with researchers, she wrote, “parents mention that they appreciate the additional family time and perceive other benefits of the schedule for their children, and they overwhelmingly indicate that they would choose to keep a four-day schedule over switching back to a five-day schedule.”
Morton would not recommend schools adopt a four-day schedule if their main aim is saving money, boosting student attendance or recruiting and retaining teachers. Research findings “do not provide much support for the argument that four-day school weeks are delivering the intended benefits,” she wrote to JR.
Keep reading to learn more. We’ll update this collection of research periodically.
——————–
A Multi-State, Student-Level Analysis of the Effects of the Four-Day School Week On Student Achievement and Growth
Emily Morton, Paul N. Thompson and Megan Kuhfeld. Economics of Education Review, June 2024.
Summary: This study looks at how switching to a four-day school week affects student achievement over the course of the school year in Colorado, Iowa, Kansas, Montana, North Dakota and Wyoming. A key takeaway: On average, across those six states, students on a four-day schedule learned less during the school year than students who went to class five days a week. However, students in rural areas fared better on that schedule than students in “non-rural” areas.
Researchers studied the scores that students in grades 3-8 earned on an assessment called the Measures of Academic Progress Growth, administered each fall and spring to gauge how much kids learned over the course of the school year. The analysis uses 11 years of test score data in reading and math, collected from the 2008-09 to the 2018-19 academic year.
Researchers found that students who went to school four days a week, as a whole, made smaller gains in reading during the academic year than students who went five days a week. They also earned lower scores in reading on the spring assessment, on average.
When researchers looked at the data more closely, however, they found differences between students attending rural schools and students attending schools located in towns and suburbs — communities the researchers dubbed “non-rural.”
Although adopting a four-day schedule had little to no impact on kids at rural schools, student performance fell considerably at schools in non-rural areas. Those children, as a whole, made less progress in reading and math during the academic year than children attending non-rural schools that operated five days a week. They also earned lower scores in both reading and math on the spring exam.
“The estimated effects on math and reading achievement in non-rural four-day week schools are ‘medium’ and meaningful,” the researchers write, adding that the difference is roughly equivalent to a quarter of a school year worth of learning in the fifth grade.
Researchers also discovered that student performance at schools with four-day schedules varied by gender and race. At schools using a four-day-a-week schedule, girls made smaller gains in reading and math than boys, on average. Hispanic students made less progress in math than white students, who made less progress in math than Native American students.
“The estimated effects on math and reading gains during the school year are not ‘large’ by the developing standards used to interpret effect sizes of education interventions, but they are also not trivial,” the researchers write. “For the many districts and communities who have become very fond of the schedule, the evidence presented in this study suggests that how the four-day school week is implemented may be an important factor in its effects on students.”
Impacts of the Four-Day School Week on Early Elementary Achievement
Paul N. Thompson; et al. Early Childhood Research Quarterly, 2nd Quarter 2023.
Summary: This study is the first to examine the four-day school week’s impact on elementary schools’ youngest students. Researchers looked at how children in Oregon who went to school four days a week in kindergarten later performed in math and English Language Arts when they reached the third grade. What they found: Overall, there were “minimal and non-significant differences” in the test scores of third-graders who attended kindergarten on a four-day schedule between 2014 and 2016 and third-graders who went to kindergarten on a five-day schedule during the same period.
When the researchers studied individual groups of students, though, they noticed small differences. For example, when they looked only at children who had scored highest on their pre-kindergarten assessments of letter sounds, letter names and early math skills, they learned that kids who went to kindergarten four days a week scored a little lower on third-grade tests than those who had gone to kindergarten five days a week.
The researchers write that they find no statistically significant evidence of detrimental four-day school week achievement impacts, and even some positive impacts” for minority students, lower-income students, special education students, students enrolled in English as a Second Language programs and students who scored in the lower half on pre-kindergarten assessments.
There are multiple reasons why lower-achieving students might be less affected by school schedules than high achievers, the researchers point out. For example, higher-achieving students “may miss out on specialized instruction — such as gifted and enrichment activities — that they would have had time to receive under a five-day school schedule,” they write.
Effects of 4-Day School Weeks on Older Adolescents: Examining Impacts of the Schedule on Academic Achievement, Attendance, and Behavior in High School
Emily Morton. Educational Evaluation and Policy Analysis, June 2022.
Summary: Oklahoma high schools saw less fighting and bullying among students after switching from a five-day-a-week schedule to a four-day schedule, this study finds. Fighting declined by 0.79 incidents per 100 students and bullying dropped by 0.65 incidents per 100 students.
The other types of student discipline problems examined, including weapons possession, vandalism and truancy, did not change, according to the analysis, based on a variety of student and school data collected through 2019 from the Oklahoma State Department of Education and National Center for Education Statistics.
“Results indicate that 4-day school weeks decrease per-pupil bullying incidents by approximately 39% and per-pupil fighting incidents by approximately 31%,” writes the author, Emily Morton, a research scientist at NWEA, a nonprofit research organization formerly known as the Northwest Evaluation Association.
Morton did not investigate what caused the reduction in bullying and fighting. She did find that moving to a four-day schedule had “no detectable effect” on high school attendance or student scores on the ACT college-entrance exam.
Only a Matter of Time? The Role of Time in School on Four-Day School Week Achievement Impacts
Paul N. Thompson and Jason Ward. Economics of Education Review, February 2022.
Summary: Student test scores in math and language arts dipped at some schools that adopted a four-day schedule but did not change at others, according to this analysis of school schedule switches in 12 states.
Researchers discovered “small reductions” in test scores for students in grades 3 through 8 at schools offering what the researchers call “low time in school.” These schools operate an average of 29.95 hours during the four-day week. The decline in test scores is described in terms of standard deviation, not units of measurement such as points or percentages.
At schools offering “middle time in school” — an average of 31.03 hours over four days — test scores among kids in grades 3 through 8 did not change, write the researchers, Paul N. Thompson, an associate professor of economics at Oregon State University, and Jason Ward, an associate economist at the RAND Corp., a nonprofit research organization.
Scores also did not change at schools providing “high time in school,” or 32.14 hours over a four-day school week, on average.
When describing this paper’s findings, it’s inaccurate to say researchers found that test scores dropped as a result of schools adopting a four-day schedule. It is correct to say test scores dropped, on average, across the schools the researchers studied. But it’s worth noting the relationship between test scores and the four-day school week differs according to the average number of hours those schools operate each week.
For this analysis, researchers examined school districts in states that allowed four-day school weeks during the 2008-2009 academic year through the 2017-2018 academic years. They chose to focus on the 12 states where four-day school weeks were most common. The data they used came from the Stanford Educational Data Archive and “a proprietary, longitudinal, national database” that tracked the use of four-day school weeks from 2009 to 2018.
The researchers write that their findings “suggest that four-day school weeks that operate with adequate levels of time in school have no clear negative effect on achievement and, instead, that it is operating four-day school weeks in a low-time-in-school environment that should be cautioned against.”
Three Midwest Rural School Districts’ First Year Transition to the Four Day School Week
Jon Turner, Kim Finch and Ximena Uribe-Zarain. The Rural Educator, 2019.
Abstract: “The four-day school week is a concept that has been utilized in rural schools for decades to respond to budgetary shortfalls. There has been little peer-reviewed research on the four-day school week that has focused on the perception of parents who live in school districts that have recently switched to the four-day model. This study collects data from 584 parents in three rural Missouri school districts that have transitioned to the four-day school week within the last year. Quantitative statistical analysis identifies significant differences in the perceptions of parents classified by the age of children, special education identification, and free and reduced lunch status. Strong parental support for the four-day school week was identified in all demographic areas investigated; however, families with only elementary aged children and families with students receiving special education services were less supportive than other groups.”
Juvenile Crime and the Four-Day School Week
Stefanie Fischer and Daniel Argyle. Economics of Education Review, 2018.
Abstract: “We leverage the adoption of a four-day school week across schools within the jurisdiction of rural law enforcement agencies in Colorado to examine the causal link between school attendance and youth crime. Those affected by the policy attend school for the same number of hours each week as students on a typical five-day week; however, treated students do not attend school on Friday. This policy allows us to learn about two aspects of the school-crime relationship that have previously been unstudied: one, the effects of a frequent and permanent schedule change on short-term crime, and two, the impact that school attendance has on youth crime in rural areas. Our difference-in-difference estimates show that following policy adoption, agencies containing students on a four-day week experience about a 20 percent increase in juvenile criminal offenses, where the strongest effect is observed for property crime.”
Staff Perspectives of the Four-Day School Week: A New Analysis of Compressed School Schedules
Jon Turner, Kim Finch and Ximena Uribe–Zarian. Journal of Education and Training Studies, 2018.
Abstract: “The four-day school week is a concept that has been utilized in rural schools for decades to respond to budgetary shortfalls. There has been little peer-reviewed research on the four-day school week that has focused on the perception of staff that work in school districts that have recently switched to the four-day model. This study collects data from 136 faculty and staff members in three rural Missouri school districts that have transitioned to the four-day school week within the last year. Quantitative statistical analysis identifies strong support of the four-day school week model from both certified educational staff and classified support staff perspectives. All staff responded that the calendar change had improved staff morale, and certified staff responded that the four-day week had a positive impact on what is taught in classrooms and had increased academic quality. Qualitative analysis identifies staff suggestions for schools implementing the four-day school week including the importance of community outreach prior to implementation. No significant differences were identified between certified and classified staff perspectives. Strong staff support for the four-day school week was identified in all demographic areas investigated. Findings support conclusions made in research in business and government sectors that identify strong employee support of a compressed workweek across all work categories.”
The Economics of a Four-Day School Week: Community and Business Leaders’ Perspectives
Jon Turner, Kim Finch and Ximena Uribe–Zarian. Journal of Education and Training Studies, 2018.
Abstract: “The four-day school week is a concept that has been utilized in rural schools in the United States for decades and the number of schools moving to the four-day school week is growing. In many rural communities, the school district is the largest regional employer which provides a region with permanent, high paying jobs that support the local economy. This study collects data from 71 community and business leaders in three rural school districts that have transitioned to the four-day school week within the last year. Quantitative statistical analysis is used to investigate the perceptions of community and business leaders related to the economic impact upon their businesses and the community and the impact the four-day school week has had upon perception of quality of the school district. Significant differences were identified between community/business leaders that currently have no children in school as compared to community/business leaders with children currently enrolled in four-day school week schools. Overall, community/business leaders were evenly divided concerning the economic impact on their businesses and the community. Community/business leaders’ perceptions of the impact the four-day school week was also evenly divided concerning the impact on the quality of the school district. Slightly more negative opinions were identified related to the economic impact on the profitability of their personal businesses which may impact considerations by school leaders. Overall, community/business leaders were evenly divided when asked if they would prefer their school district return to the traditional five-day week school calendar.”
Impact of a 4-Day School Week on Student Academic Performance, Food Insecurity, and Youth Crime
Report from the Oklahoma State Department of Health’s Office of Partner Engagement, 2017.
Summary: “A Health Impact Assessment (HIA) utilizes a variety of data sources and analytic methods to evaluate the consequences of proposed or implemented policy on health. A rapid (HIA) was chosen to research the impact of the four-day school week on youth. The shift to a four-day school week was a strategy employed by many school districts in Oklahoma to address an $878 million budget shortfall, subsequent budget cuts, and teacher shortages. The HIA aimed to assess the impact of the four-day school week on student academic performance, food insecurity, and juvenile crime … An extensive review of literature and stakeholder engagement on these topic areas was mostly inconclusive or did not reveal any clear-cut evidence to identify effects of the four-day school week on student outcomes — academic performance, food insecurity or juvenile crime. Moreover, there are many published articles about the pros and cons of the four-day school week, but a lack of comprehensive research is available on the practice.”
Does Shortening the School Week Impact Student Performance? Evidence from the Four-Day School Week
D. Mark Anderson and Mary Beth Walker. Education Finance and Policy, 2015.
Abstract: “School districts use a variety of policies to close budget gaps and stave off teacher layoffs and furloughs. More schools are implementing four-day school weeks to reduce overhead and transportation costs. The four-day week requires substantial schedule changes as schools must increase the length of their school day to meet minimum instructional hour requirements. Although some schools have indicated this policy eases financial pressures, it is unknown whether there is an impact on student outcomes. We use school-level data from Colorado to investigate the relationship between the four-day week and academic performance among elementary school students. Our results generally indicate a positive relationship between the four-day week and performance in reading and mathematics. These findings suggest there is little evidence that moving to a four-day week compromises student academic achievement. This research has policy relevance to the current U.S. education system, where many school districts must cut costs.”
Other resources
- The Education Commission of the States offers a 50-state comparison of public school students’ instructional time requirements. For example, students in Colorado are required to be in school for a minimum of 160 days each academic year while in Vermont, the minimum is 175 days and in North Carolina, it’s 185.
- The State of the American Teacher project offers insights into how teachers feel about their jobs and the education field as a whole. In early 2022, RAND Corp. surveyed a nationally representative sample of teachers, asking questions on topics such as job-related stress, school safety, COVID-19 mitigation policies and career plans. Survey results show that 56% of teachers who answered a question about their attitude toward their job “strongly” or “somewhat” agreed with the statement, “The stress and disappointments involved in teaching aren’t really worth it.” Meanwhile, 78% “strongly” or “somewhat” agreed with the statement, “I don’t seem to have as much enthusiasm now as I did when I began teaching.”
- Opinions about the four-day school week vary among school board members, district-level administrators, school principals and teachers. These organizations can provide insights: the Schools Superintendents Association, National School Boards Association, National Association of Elementary School Principals and National Association of Secondary School Principals.


Public funding for sports stadiums: A primer and research roundup
In June 2023, Nevada legislators approved $380 million in public funding for a 30,000-seat ballpark for the Oakland A’s, who are expected to throw their first pitch in Las Vegas in 2028 after Major League Baseball owners approved the franchise move in November.
It’s the latest public commitment of hundreds of millions of dollars for a professional sports stadium. In the U.S., most franchises in the four major sports leagues — MLB, the National Football League, the National Basketball Association and the National Hockey League — are valued at over $1 billion.
Across those leagues there have been eight new stadiums or arenas built since 2020, at a total construction cost of roughly $3.3 billion, according to a September 2023 paper in the Journal of Policy Analysis and Management. About $750 million in public funds went toward those construction projects, the paper finds.
When government dollars are allocated it’s usually through a legislature passing a law, or by public vote. Voters in Kansas City, for example, in April 2024 widely rejected a sales tax bump to pay for a new downtown stadium for MLB’s Royals.
“I like to say that you can fit a majority of the city council in the owner’s box but you can’t fit a majority of the electorate,” says Kennesaw State University economist John Charles Bradbury.
The approved public funding in Las Vegas represents about one quarter of the total cost of the planned stadium, pegged at $1.5 billion. Proponents estimate the A’s stadium in Las Vegas will create thousands of jobs and have an annual economic impact of $1.3 billion, news outlets have reported.
Economic research for decades has found that, by and large, the fiscal returns for residents — in the form of increased economic activity and job growth — are far smaller than public expenditures, which have recently approached or exceeded half a billion dollars per stadium.
This primer will help journalists understand the history of public financing for stadium construction and empower them to use academic research to interrogate claims that these projects mean big bucks for communities.
The research also finds:
- Journalists often report figures from press releases and economic impact statements without questioning the assumptions of those analyses.
- Of the dozens of stadiums built in the past two decades for the four largest American sports leagues, about 4 in 10 were financed at least in part with municipal bonds exempt from federal taxes — which places part of the financial burden of stadium financing on residents nationwide.
- Football and baseball stadiums may increase foot traffic to nearby businesses, but basketball and hockey arenas do not.
- Overall, stadiums tend to shift economic activity, not create new spending.
- Expansion teams are likely to favor markets that already have strong employment and business growth.
A coming stadium construction boom?
Las Vegas is hardly alone. Economists have found that every 30 years or so there’s a wave of public financing for building stadiums or revamping existing ones.
A construction boom may already be under way in the U.S.
For example, Wisconsin will provide $500 million to renovate the Milwaukee Brewers ballpark, and more than $1 billion in public bonds will go toward a new stadium for the NFL’s Tennessee Titans. And the MLB’s Tampa Bay Rays have asked St. Petersburg city councilors to approve more than $400 million for a new ballpark along with nearby infrastructure improvements.
If you’re covering public financing for sports franchises, you’ll want to know what the research says about this topic. This is critical to providing thorough coverage to audiences.
A brief history of public financing for sports stadiums
Modern stadiums were first constructed during the early and mid-1900s, around the two world wars.
“Sports venues were almost exclusively privately financed until the 1930s, when they became largely public ventures,” write the authors of a recent paper in the Journal of Policy Analysis and Management, featured in the research roundup below.
More stadiums were built as leagues expanded and teams moved cities throughout the 1960s and 1970s.
Another construction boom came in the 1990s, with many new stadiums replacing older ones, along with new venues for expansion franchises.
“The median public share of venue construction costs declined from 70% in the 1990s and 2000s to approximately half of construction costs in the 2010s,” write the authors of the Journal of Policy Analysis and Management paper. “Newly opened and planned venues in the 2020s have received roughly 40% of funding from taxpayers.”
While the share of public financing has fallen, the authors find that the amount of public money has risen, from a median of $168 million in public funds per stadium in the 1990s, to $350 million in the 2010s, to $500 million in the 2020s across the four major U.S. sports leagues.
Even stadiums ostensibly built with private funds can come with public costs.
For example, the New England Patriots built Gillette Stadium in 2002 without direct public dollars, but the franchise benefitted from at least $70 million in state money for nearby road, sewer and other infrastructure improvements, according to the Boston Globe, which the paper authors cite.
Economic activity and stadiums: ‘A transfer of wealth’
While Fenway Park in Boston and Wrigley Field and Soldier Field in Chicago have stood for around 100 years, many stadiums built in the past 50 years have already been replaced for a variety of reasons, despite better construction materials and methods.
For example, the Texas Rangers’ ballparks have been replaced every 27.5 years, on average, while Atlanta Braves’ ballparks have been replaced after 26 years, on average. Among the major sports leagues, 31 stadiums and 31 arenas will be 30 years old or more by 2030, according to Bradbury and co-authors in the Journal of Policy Analysis and Management paper.
Journalists covering asks of public money for private sports projects should be aware of the large body of research on these public investments.
Despite perennial claims from team owners that building new stadiums or revamping existing ones will result in a fiscal and jobs boom for a city or region, research consistently shows that the hundreds of millions of public dollars that are often outlaid are not typically a sound investment.
“You might see a little bit of a resurgence in the area right around the stadium, but it comes at a cost to less commerce in the outlying area, which is exactly what we’d expect,” says Bradbury, who is the current president of the North American Association of Sports Economists. “This is just a transfer of wealth within the community.”
This transfer of wealth may indeed be the point for some city officials, as College of the Holy Cross economist Victor Matheson explains in an October 2018 essay, also in the Journal of Policy Analysis and Management.
For example, when the taxpayers of Arlington, Texas, finance local stadiums, such as for the Dallas Cowboys and the Rangers, the games those teams play move consumer dollars from other parts of the state to Arlington.
“While, again, regional economic activity is unchanged, Arlington’s economy benefits at the expense of other cities and towns in the area,” Matheson writes. He also notes that fiscal reports produced by sports franchises “have been shown to suffer from significant theoretical flaws that make their conclusions suspect at best, and simply false at worst.”
But Matheson argues that while the current level of public spending on sports stadiums is out of balance with the returns on those investment, in certain circumstances some level of public funding may be appropriate.
He points to the 2004 Athens Olympics as a catalyst for infrastructure development there, and a minor league baseball stadium in Worcester, Massachusetts, as providing the political impetus for $35 million in transportation funding from the state, including to make a particularly dangerous intersection near the ballpark safer.
“Obviously, it would be better for local taxpayers to get the needed infrastructure improvements without the wasteful expense of hosting the Olympics or building a baseball stadium, but government activities are not always without friction, and using a stadium project to spur other more useful infrastructure projects may be a second-best solution,” Matheson writes.
The cost-per-taxpayer of a stadium partially financed through public funds may be small in some cases, but it can also be relatively large. Oklahoma City Thunder ownership, for example, is contributing $50 million to build their new arena, compared with the public outlay of $900 million, which comes out to thousands of dollars per adult in the city.
“People often ask me, they’ll say, ‘Well, you’re always against stadiums.’ And I’ll say, ‘Well, yeah, my guess is most pulmonologists are against smoking,’” says Bradbury. “I mean, the evidence is clear. And I think that journalists feel a need to cover all sides of an issue, and I totally understand that. But it’s about accurate coverage, not equal-balance coverage.”
Research roundup
Public Policy Toward Professional Sports Stadiums: A Review
John Charles Bradbury, Dennis Coates and Brad Humphreys. Journal of Policy Analysis and Management, September 2023.
The study: The authors break down a range of policy considerations for public funding of stadiums. They provide a history of stadium funding since the 1900s, examine research efforts to quantify intangible social benefits of sports teams, describe prominent public funding mechanisms and cast a critical eye toward news reporting.
The findings: With many large U.S. cities facing fiscal crises in the 1980s, government officials began to push the narrative of sports stadiums as economic drivers, “where each dollar spent generates more than one dollar of economic activity as it is recirculated within the community — thereby growing employment income, property values and tax revenues,” the authors write.
Economists began to study the issue around this time. By the turn of the century, “economists were largely in agreement that stadiums were poor public investments,” in terms of tangible benefits, like jobs and spending, “and more recent studies continue to confirm these findings.” Economists then began to explore whether there were intangible benefits to residents of a city with a professional sports franchise — the cultural pride from living in a “big league” city, for example.
One way economists do this is through something called the contingent valuation method, which surveys residents on what they would personally pay for their city to host a sports team. These individual values are then extrapolated to a wider population to put a dollar value on the intangible factors residents enjoy from simply having a professional franchise, whether they go to games or not. Based on results from seven studies conducted in the 2000s and 2010s, “non-use values” amount to “13% of total capital construction costs and 16% of public contributions,” suggesting that “intangible social benefits of hosting professional sports teams are well below levels needed to justify typical subsidies.”
In looking at news coverage of public subsidy proposals for sports franchises, the authors note that “economic impact estimates from advocacy reports may be repeated without external validation of credibility, and press release statements from stadium boosters are quoted in stories without critical assessment.”
The authors write: “As a potential institutional reform, communities should assess all stadium proposals through referendums and initiatives, a once-common practice which has declined over the last few decades. Public votes ensure that subsidies are congruent with voter preferences and allow time for careful consideration of all relevant costs and benefits, so that voters can make informed decisions.”
Growth Effects of Sports Franchises, Stadiums and Arena: 15 Years Later
Dennis Coates. Chapter from The Economic Impact of Sports Facilities, Franchises, and Events, October 2023.
The study: The author, who conducted foundational research with Brad Humphreys starting in the mid-1990s into how sports stadiums affect per capita income, returns to this question with another 17 years of data, from 1969 to 2011. This analysis adds hockey and soccer franchises in addition to MLB, NFL and NBA — along with the American Basketball Association, which merged with the NBA in 1976 — and covers all urban areas in the U.S., including those without a professional team.
The findings: Average personal income grew about 1.4% per year over the period studied, regardless of whether there was a sports stadium in the area. The economic effects of sports franchises account for less than 1.5% of local economic activity, measured by personal income, wages and salaries, and wages per job.
The author writes: “The results of this exercise are largely consistent with the findings of Coates and Humphreys and of numerous other studies that have found that the effect of sports franchises and stadium and arena construction on local economies is weak or nonexistent. Indeed, franchises, stadiums, and arenas may be harmful rather than beneficial to the local community.”
Do Local Businesses Benefit from Sports Facilities? The Case of Major League Sports Stadiums and Arenas
Timur Abbiasov and Dmitry Sedov. Regional Science and Urban Economics, January 2023.
The study: The authors explore a single economic consequence of sports stadiums — foot traffic to nearby retail and food establishments — in a single year, 2018, for MLB NBA, NFL and NHL franchises. Precise foot traffic for 92 sports facilities and surrounding businesses is from SafeGraph, a company that tracks “location data of mobile devices with installed participating applications,” the authors write.
They acknowledge that “the grounds for subsidizing professional sports are weak,” based on past research, but also cite news reports suggesting businesses near sports stadiums suffered curtailed revenue during the COVID-19 pandemic.
The findings: Every 100 visits to a baseball stadium generates 29 visits to nearby restaurants and similar establishments, and six visits to retail stores. The authors find similar results for football stadiums, but little business sale spillover for basketball and hockey arenas. The authors note that professional football and baseball games typically draw much larger crowds than basketball and hockey games.
Basketball and hockey games have a slight negative effect on foot traffic to health, finance and education-related businesses. The authors note that these sports often have arenas located in central business districts, which may lead people who are not going to a game to avoid those areas during game time.
The authors “find that a median sports facility generates approximately $11.3 million of annual additional spending for food and accommodation and retail businesses, with the aggregate spillovers varying substantially across facilities and sports.”
They do not account for negative effects of sports stadiums — such as increased crime, as explained in the next paper — or the revenue of nearby businesses compared with the public costs of building a stadium or improving an existing one.
The authors write: “Our results indicate that the chances of a community economically benefitting from a sports facility via the spillover channel are higher if the facility hosts a popular team and is visited frequently.”
The Impact of Professional Sports Franchises and Venues on Local Economies: A Comprehensive Survey
John Charles Bradbury, Dennis Coates and Brad Humphreys. Journal of Economic Surveys, September 2022.
The study: The authors review the findings of more than 130 studies on economic outcomes of sports stadiums published between 1974 and 2022, the bulk of them published since 2000.
The findings: Local economic activity is by and large unaffected by sports stadiums, “and the level of venue subsidies typically provided far exceeds any observed economic benefits,” the authors write. There is “deep agreement in research findings” that “sports venues are not an appropriate channel for local development policy,” they add.
Sports stadiums can lead to positive effects for communities, such as improved amenities, like pedestrian-friendly zones. But they also come with negative effects. For example, research links sports events with crime. The “positive association between crime and sporting events is perhaps the most robust empirical finding in the economic effects of sports literature,” the authors write.
Why do sports stadiums continue to garner public subsidies? Among other reasons, such as team owners threatening to relocate, the authors note that the benefits of sports stadium subsidies are concentrated in a few hands — namely and primarily the owners.
Costs, meanwhile, are spread across taxpayers. The public cost of Camden Yards in Baltimore came to $15 per local household per year, according to research from the Brookings Institution that the authors cite. They suggest this creates a situation in which wealthy beneficiaries have great incentive to lobby politicians and advertise in favor of subsidies, with little incentive to mobilize opposition because each taxpayer’s individual cost may be low.
The authors write: “Though findings have become more nuanced, recent analyses continue to confirm the decades-old consensus of very limited economic impacts of professional sports teams and stadiums. Even with added nonpecuniary social benefits from quality-of-life externalities and civic pride, welfare improvements from hosting teams tend to fall well short of covering public outlays.”
Tax-Exempt Municipal Bonds and the Financing of Professional Sports Stadiums
Austin Drukker, Ted Gayer and Alexander Gold. National Tax Journal, March 2020.
The study: Of the 57 stadiums built in the past two decades for the four largest American sports leagues, about 4 in 10 were financed at least in part with municipal bonds exempt from federal taxes. State or local governments issue the bonds, then the interest bond buyers earn is exempt from federal taxes, meaning “tax-exempt municipal bonds confer an indirect federal subsidy to the issuers,” the authors write. Bond buyers accept lower interest rates — saving interest payment dollars for states and localities — because they know they will get a tax break on their investment return.
NFL stadiums are the most expensive, with an average cost of $1 billion. But baseball stadiums are most heavily financed through tax-exempt bonds. On average, $466 million of baseball stadium costs are financed through such bonds. The authors examine the estimated value of those bonds issued since 2000.
The findings: The value of the federal tax exemption is $3.6 billion across the $16.7 billion worth of bonds issued to finance stadium construction, the authors estimate. But the estimated loss in federal tax revenue is considerably higher: $4.3 billion. The authors explain that the reason for the difference is that a portion of bond buyers would still buy those bonds at a lower return rate than the subsidy offers.
The authors write: “Most residents of, say, New York, Massachusetts, or California — unless they are avid fans — gain nothing from the Washington-area football team’s decision to locate in Virginia, Maryland, or the District of Columbia. Yet, under current federal law, taxpayers throughout the country ultimately subsidize the stadium, wherever it is located … Ultimately, the problem is one of rent seeking, since professional sports leagues are able to extract local and federal subsidies by exerting concentrated power while the costs of the subsidies are diffuse.”
Economic Development Effects of Major and Minor League Teams and Stadiums
Nola Agha and Daniel Rascher. Journal of Sports Economics, November 2020.
The study: The authors explore whether new stadiums for major and minor league teams affect economic development, measured by employment and business growth. They use Census Bureau data from 2004 to 2012 covering 871 markets. There were 65 new teams, 67 teams that departed a city and 68 new stadiums built during the period studied. The included top-tier professional leagues and their development affiliates are MLB, NFL, NBA, NHL, Major League Soccer, and the Women’s National Basketball Association. The WNBA saw three teams join and five leave the league but was the only professional league without a new arena during the period studied.
The findings: The authors note that much research has focused on the economic effects of major league venues. Stadiums and arenas built between 2000 and 2018 cost more than $40 billion total. Spending on minor league venues account for a sizeable chunk over that time — $9.6 billion, according to the authors, and many of those developmental team venues are in the same market as major league teams.
On the whole, new major league teams and new stadiums do not affect economic development, and the findings suggest teams tend to enter markets with strong employment and business growth. New minor league sports teams also do not tend to affect employment, but for markets between 100,000 and 499,000 people, the findings suggest that new minor league sports stadiums can lead to a slight uptick in new businesses.
The authors write: “Overall, we find no substantial evidence that entry of a new team or stadium is associated with any net gains related to economic development, other than for minor league team entry in smaller markets and employment effects limited to the period of construction.”


Rethinking the role of the office
The previous installment of the Work in Progress series looked at the nature of work and some of the tensions with which organizations are grappling. Now we examine the role of the office and how the topic connects to vibrancy and doing our best work.
Post-pandemic offices are emptier. Buildings once filled with workers are eerily quiet. In some organizations, managers have offered shift options that minimize risk but bring workers back to the office – Monday, Tuesday, and Wednesday this week, and Wednesday, Thursday, and Friday the following week, allowing for an overlap day. In other agencies, there is no overlap: employees choose which day they will come in or if they come in at all.
But the former hum, vibrancy, and liveliness is missing. What does this lack of vibrancy mean? Is the hum necessary, and if yes, necessary for what?
“Is the hum necessary, and if yes, necessary for what?”
We now know that we do not have to be in the office to be productive. For some, productivity improved working from home. A BBC article written in 2021, while the pandemic was still in full sway, questioned the role of the office and whether we still need it. So, what should organizational leaders with underused office spaces do? Do they move, downsize, or renegotiate their lease agreements? Should they hang on to the space in case workers want to return one day?
Let’s look at an example of how one collective tackled the empty-office problem and what they learned as a result.
Foundation House is a co-location shared space for advancing Canadian philanthropy and is home to 12 distinct organizations. (Note: none of these organizations offer direct services to the public.) The space – which was intentionally designed to foster collaboration, engagement, and community with like-minded tenants and had done that exceptionally well prior to the pandemic – is now much emptier. In the latter part of 2022, the Foundation House senior leadership team decided to do something about the problem and engaged a “design thinking” consultant.
"Design thinking seeks to explore situations based on people’s interests, wishes, and needs and uses an interactive, participatory method of generating ideas and translating these into product possibilities."
- Cameron Norman, Cense
“Design thinking,” says Cameron Norman, principal and president of strategic design company Cense and facilitator of the Foundation House rethinking project, “seeks to explore situations based on people’s interests, wishes, and needs and uses an interactive, participatory method of generating ideas and translating these into product possibilities.”
Because space is a big investment, Norman advises leaders grappling with the underused-space problem to start the discussion with the following questions:
- How does the space we work in allow us to do what we do better?
- What are we all about?
- What is it that we, by coming together, do that we can’t or won’t do otherwise?
- How do we help our staff to be better at what we do?
Through workshops, confidential surveys, consultations, and interviews with staff and tenant organization leaders, Norman helped Foundation House gather critical information to move forward. Here’s what they learned.
Foundation House’s tenants, those working virtually and those who worked in the office, valued and wanted interaction and collaboration with each other to continue. They wanted opportunities to learn and felt that the office space could foster that through information sharing, professional development, or other learning forums. In addition, the tenants are willing to look at expansion or opening of the space to other groups as a possible solution to the underuse issue. The design-thinking process also revealed potential barriers to in-office reengagement, including transportation, commuting, safety protocols, and availability of private space to have online meetings.
“Tackling the space problem helped Foundation House tenants clarify what they want: opportunities for interaction, collaboration, and professional development. They wanted to feel vibrant again.”
How Foundation House tenants will actualize the learning is still being examined. Tackling the space problem, however, helped them clarify what they want: opportunities for interaction, collaboration, and professional development. They wanted to feel vibrant again.
But if workers are not in shared workspaces, if they are in the office sometimes or working different days, how can this vibrancy happen? How do leaders help staff feel a sense of community and belonging within their organization when staff are not together in person? What will happen if staff do not feel engaged? What fosters engagement? How important is org culture? And what is it that workers need to do their best work?
Three senior leaders of Foundation House shared their perspectives and learning around the space issue. Their views reflect how closely intertwined space is with the issue of doing one’s best work and keeping vibrant.
Collusion of people sparks ideas
Bruce Lawson, special advisor to The Counselling Foundation of Canada, says he is much more productive at the office than when working from home. He misses the previous vibrancy, camaraderie, and collaboration among the various teams. “The collusion of people sparks ideas,” he says. “Conversations are easier, richer, and faster in person. Colleagues in close physical proximity allow you to think out loud in their presence. It’s harder to express random thoughts when you have to pick up the phone or schedule a meeting.”
"The collusion of people sparks ideas. Conversations are easier, richer, and faster in person."
- Bruce Lawson, Counselling Foundation of Canada
Lawson is a perfect example of a person who thrives in a lively, populated workspace. He says that Foundation House was intentionally designed, and like-minded tenants selected, for the beauty that can come from cross-collaboration. And while he would love to see Foundation House return to its pre-pandemic hum, he knows it must not be mandated. “People need to see a personal benefit from showing up and engaging. Each organization needs to make that value proposition.”
There is value in coming together
Kay Castelle, executive director of the Career Education & Research Institute for Counselling (CERIC), joined the Foundation House team in January 2023. She has no history of working with the tenants in that space. For her, the space discussion is not just about the physical space; it’s also about how we repurpose workspaces for the future. She sees a parallel between the transformations taking place now in how society is viewing work and the way things shifted during and after the Industrial Revolution. Essentially, what people want in and from careers has changed significantly post-pandemic. The challenge for leaders is how to balance the unique contextual needs of each staff member with employer expectations.
"The collusion of people sparks ideas. Conversations are easier, richer, and faster in person."
- Kay Castelle, CERIC
Castelle poses some reflective questions about the staff-working-together-in-the-same-space issue: “Is what we are hanging on to pure nostalgia, or is it critical for career building? How do we move beyond what we are etched in to adequately address what’s happening right now? How do we create and maintain consistent policies for everyone, whether they work in the office or remotely? What is not viable anymore? What has been lost?”
There is no easy way to go back to what was, she notes. “As we navigate through [these] unprecedented times, there’s significant value in critically assessing the benefits and disadvantages of different work models.” Castelle sees the need for a middle ground where staff have opportunities for community building and collaboration, whether working virtually or in person.
We can all own the future
Riz Ibrahim, president and CEO of The Counselling Foundation of Canada, leans back in his chair and considers the question about what he’s learned from the design-thinking process. “Where we are is not where we’re going to be,” he says, almost as a reminder to release the past. For him, the pandemic disrupted things taken for granted about how we worked: the five-day workweek, easy access to colleagues on any given workday, conversations that sparked naturally, and the collaborations that resulted. And the food – sharing over lunches, building alliances, and getting to know people.
"Where we are is not where we’re going to be … We are not going to use space like before. And that’s OK."
- Riz Ibrahim, Counselling Foundation of Canada
Ibrahim notes that while pre-pandemic occupants of Foundation House can name what they miss of those “glory” days, staff members hired during the pandemic do not know what they never had. To underscore this point, he notes that between 40 and 50% of current staff do not own the past that he knew – but, he says optimistically, “we can all own the future.” For him the next logical step is to make sure collaboration happens between people working virtually and those in the office and that all staff feel a sense of belonging and community.
So his advice to others on the topic of repurposing space is based on his own coming to terms:
- We are not going to use space like before. And that’s OK.
- The design thinking gave us permission to think more broadly – to explore other opportunities for use of our space.
- More investigation and coordination is required to fully investigate any option.
- We are still in the flux phase – therefore, hold loosely to ideas while ensuring that mission remains central to any decisions about space.
There you have it. Three leaders, nostalgia aside, choosing to own a future where collaboration and engagement happen. The square footage of the physical offices may have to be repurposed. Staff may not all be in on the same days, and some may work in a different place altogether. But all agree on the value and necessity of team building and the benefits that come from collective sharing. It fosters personal and organizational vibrancy. To them, this is one element that is critical to retain, foster, and fight for.
Empty spaces can always be repurposed, but keeping organization, mission, and staff well-being central to every decision about space is critical. To quote Norman, “The space does not care.” But care communities do!